The bathroom scale is probably the most popular fitness tool in the world — and one of the least useful. It gives you a single number that cannot tell you whether you lost fat, gained muscle, retained water, or simply ate a large dinner. If your only measure of progress is weight, you are almost certainly underestimating how much your body is actually changing. Here is how to track your fitness progress using metrics that actually reflect what is happening.
Why the Scale Misleads You
Body weight fluctuates by 1–2 kg (2–5 lbs) in a single day due to hydration, sodium intake, glycogen stores, and digestion. Over weeks of training, especially with HIIT or strength work, you can lose fat and gain lean muscle simultaneously — a process called body recomposition — and the scale may barely move.
The science backs this up. A landmark meta-analysis reviewing data from 398,716 individuals found that cardiorespiratory fitness was a far stronger predictor of mortality than BMI or body weight. Obese but fit individuals had a lower mortality risk than unfit individuals of normal weight. A 2022 study in JACC analysing over 750,000 U.S. veterans found that each 1-MET increase in fitness (roughly 3.5 ml/kg/min of VO2 max) was linked to a 13–15% reduction in mortality risk — regardless of BMI.
The message is clear: fitness matters more than what the scale says. So track fitness.
7 Ways to Measure What Actually Matters
1. Body Measurements
A tape measure is cheap, accurate, and tells you things the scale cannot. Tracking waist circumference, hip circumference, chest, arms, and thighs reveals where your body is changing — even when total weight stays flat.
Waist circumference is especially valuable. Research published in Pediatric Obesity found that waist-circumference-to-height ratio had better longitudinal agreement with DEXA-measured fat mass than BMI in a study of 7,237 children, and the same principle holds for adults. A shrinking waist with stable weight almost always means fat loss and muscle gain.
How to do it: Measure at the same time of day (morning, before eating), at the same anatomical landmarks, every 2–4 weeks. Record five sites: waist (at navel), hips (widest point), chest, upper arm (flexed), and mid-thigh.
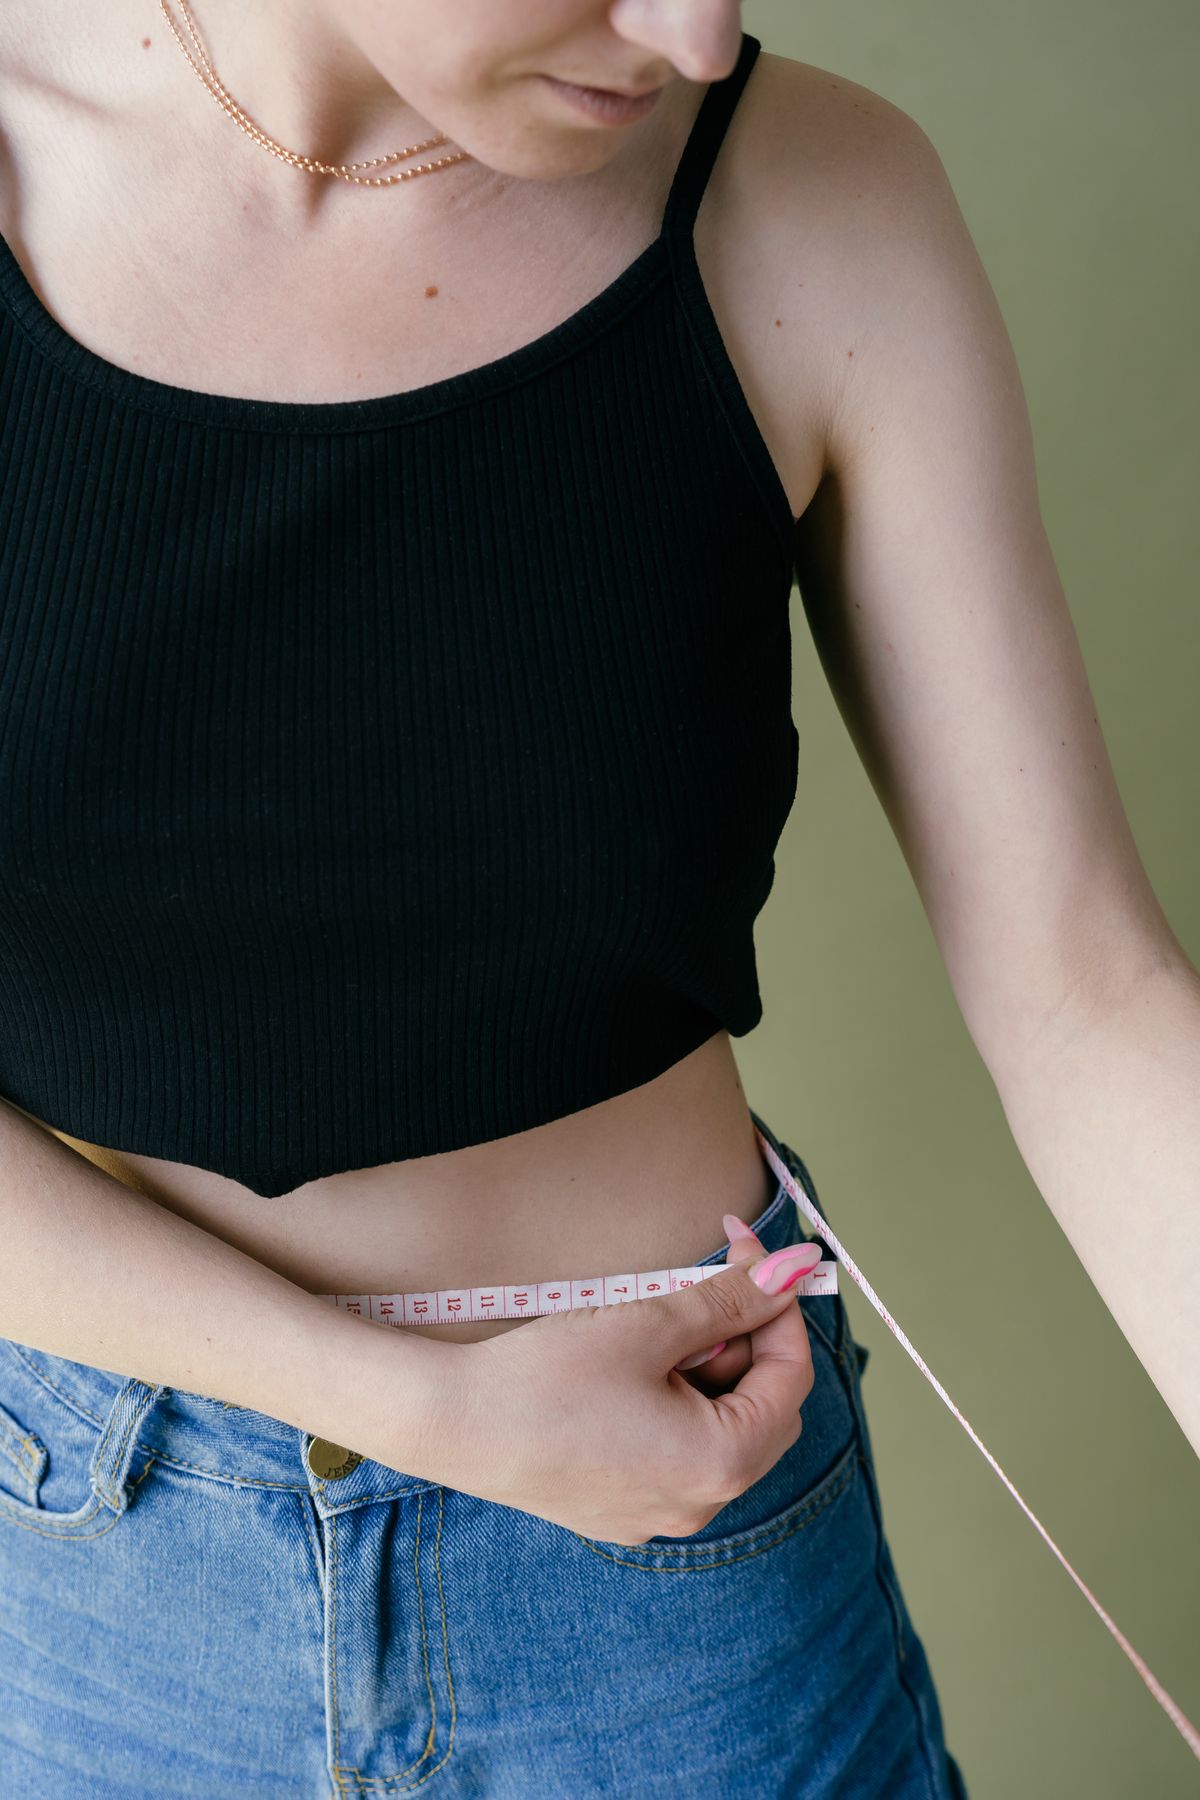 Person measuring their waist with a tape measure for fitness tracking
2. Progress Photos
Your mirror adjusts gradually — you see yourself every day, so small changes become invisible. Photos taken under consistent conditions freeze a moment in time and make change undeniable when you compare across weeks and months.
Research in behavioural psychology shows that visual evidence of progress triggers dopamine release, reinforcing the behaviours that created the change. A study published in the Journal of Consumer Research found that visual documentation increased both satisfaction and persistence with long-term goals.
How to do it: Take front, side, and back photos in the same clothing, same lighting, same time of day, every 4–6 weeks. Do not compare week to week — compare month to month.
3. Workout Performance
If you are lifting heavier, completing more reps, finishing rounds faster, or lasting longer before fatigue, you are getting fitter — regardless of what the scale says. Performance metrics are the most direct measure of functional improvement.
Track these numbers in a workout log or app:
| Metric | What It Tells You | Example |
|---|---|---|
| Weight lifted | Strength gains | Squat: 40 kg → 55 kg |
| Reps completed | Muscular endurance | Push-ups: 8 → 15 |
| Rounds in AMRAP | Work capacity | 4 rounds → 6 rounds |
| Time to complete | Speed and conditioning | 12:30 → 10:45 |
| Rest time needed | Recovery efficiency | 90s rest → 60s rest |
Free on iOS
TRAIN SMARTER
Build custom HIIT, Tabata, AMRAP, EMOM and Circuit workouts. Precision timer, streak tracking and analytics — free on iOS.
4. Resting Heart Rate
Your resting heart rate (RHR) is one of the simplest and most reliable indicators of cardiovascular fitness. As your heart becomes stronger through training, it pumps more blood per beat, so it needs fewer beats per minute at rest.
A 2022 systematic review and meta-analysis published in Frontiers in Physiology found that both endurance and high-intensity training significantly improved cardiac parasympathetic activity — the branch of the nervous system responsible for lowering heart rate at rest. Untrained adults typically have an RHR of 60–80 bpm, while consistently trained individuals often sit at 50–60 bpm or lower.
How to do it: Measure your pulse first thing in the morning, before getting out of bed, for 60 seconds. Track it weekly. A downward trend over weeks indicates improving cardiovascular fitness.
5. How Your Clothes Fit
This is the lowest-tech metric on the list, and one of the most honest. If your jeans are looser at the waist but your shirt is tighter across the shoulders, your body composition is shifting — even if the scale has not budged.
Clothes respond to changes in circumference, not mass. A person who loses 3 kg of fat and gains 2 kg of muscle will show almost no change on the scale but will notice a meaningful difference in how their clothes drape and fit.
6. Energy, Mood, and Sleep
Subjective metrics matter. A 2023 study in Sleep Health found that regular physical activity increased self-reported daily energy levels by 20% and correlated with better sleep quality. A separate 2023 study in Health Psychology Review found that tracking non-scale metrics like sleep duration and energy increased life satisfaction by 18%.
Rate these on a simple 1–5 scale each week:
- Energy — How do you feel by mid-afternoon?
- Sleep quality — Are you falling asleep faster and waking more refreshed?
- Mood — Do you notice less anxiety or irritability on training days?
These are early indicators of fitness improvement. They often change before any physical metric does.
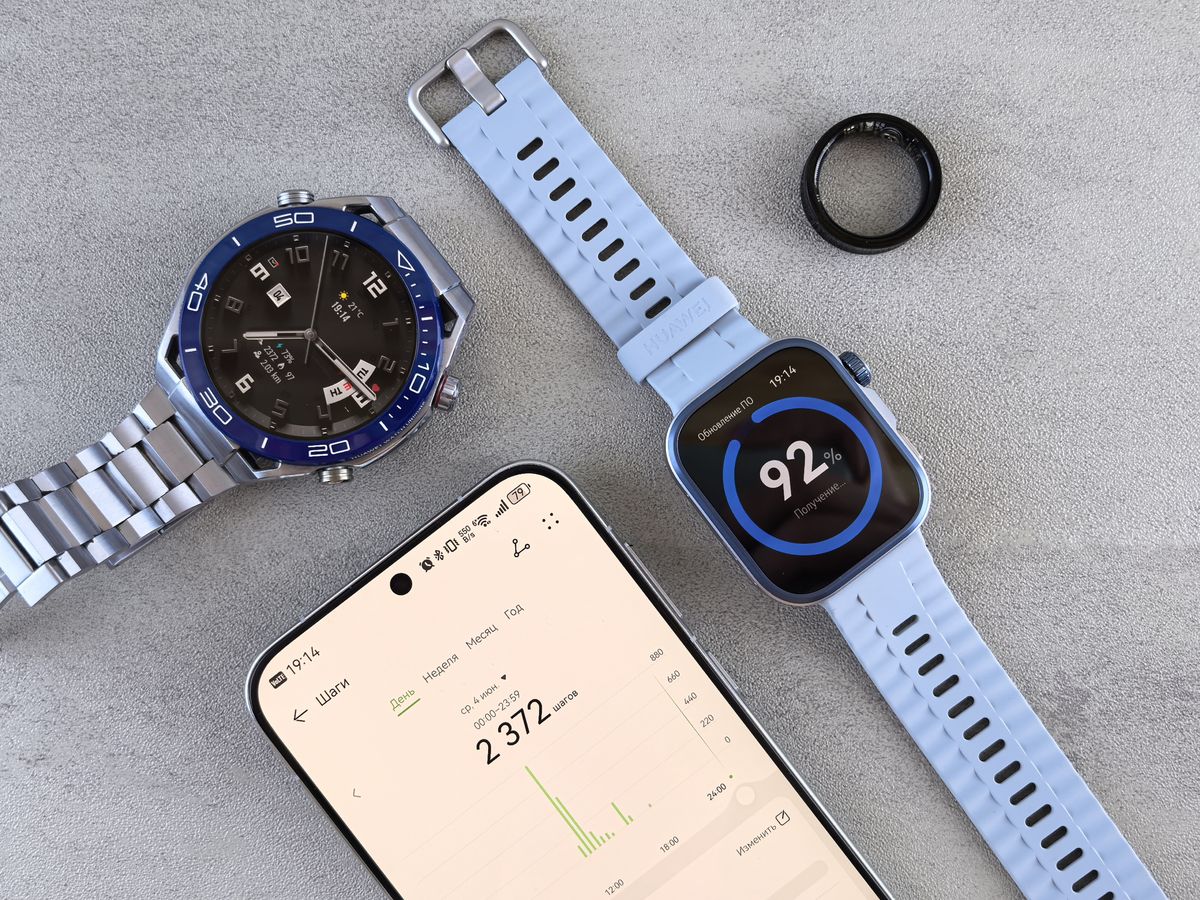 Smartwatch, fitness ring, and phone displaying health tracking data
7. Cardiovascular Benchmarks
Beyond resting heart rate, two more markers reveal aerobic progress:
-
Heart rate recovery (HRR): How quickly your heart rate drops after intense effort. A 2010 study in Circulation found that faster heart rate recovery was independently associated with lower mortality risk. Measure your heart rate immediately after a hard interval, then again 60 seconds later. A drop of 20+ bpm in the first minute indicates good cardiovascular fitness.
-
VO2 max estimate: Many smartwatches now estimate VO2 max from heart rate and pace data. While less accurate than lab testing, the trend over time is useful. Improving your estimated VO2 max by even a few points reflects real aerobic gains.
How Often Should You Track?
Not everything needs to be measured every day. Over-tracking leads to obsession over noise instead of signal. Here is a practical schedule:
| Metric | Frequency |
|---|---|
| Workout performance | Every session |
| Resting heart rate | Weekly |
| Energy, mood, sleep | Weekly |
| Body measurements | Every 2–4 weeks |
| Progress photos | Every 4–6 weeks |
| Clothes fit check | Monthly |
The goal is to capture trends, not snapshots. Any single data point can mislead. A series of data points over 8–12 weeks tells you the truth.
Why Self-Monitoring Works
This is not just anecdotal. A 2009 meta-regression by Michie et al. analysing interventions for physical activity and healthy eating found that self-monitoring was one of the most effective behaviour change techniques — especially when combined with goal-setting and feedback. Interventions that included self-monitoring produced significantly better outcomes than those that did not.
The mechanism is straightforward: tracking creates a feedback loop. You set a target, record what you did, compare the two, and adjust. Without tracking, you are guessing — and guessing makes it easy to underestimate progress or overestimate effort.
Track Your Fitness Progress With Hiitify
Hiitify gives you the tools to track the metrics that matter. Log every HIIT session with custom intervals, monitor your workout streaks to see consistency building over time, and review your training history to spot performance trends. When you can see the work adding up — session by session, week by week — progress stops being invisible.
Free on iOS
TRAIN SMARTER
Build custom HIIT, Tabata, AMRAP, EMOM and Circuit workouts. Precision timer, streak tracking and analytics — free on iOS.
Sources & Further Reading
Research
- Michie, S. et al. (2009). Effective Techniques in Healthy Eating and Physical Activity Interventions: A Meta-Regression. Health Psychology. View on PubMed
- Barry, V.W. et al. (2014). Fitness vs. Fatness on All-Cause Mortality: A Meta-Analysis. Progress in Cardiovascular Diseases. View on PubMed
- Kokkinos, P. et al. (2022). Cardiorespiratory Fitness and Mortality Risk Across the Spectra of Age, Race, and Sex. JACC. View on PubMed
- Christou, D.D. et al. (2010). Impact of Exercise on Heart Rate Recovery. Circulation. View on AHA Journals
- Grässler, B. et al. (2021). Effects of Different Training Interventions on Heart Rate Variability and Cardiovascular Health. Frontiers in Physiology. View on Frontiers
- Simmonds, M. et al. (2024). Waist-circumference-to-height-ratio had better longitudinal agreement with DEXA-measured fat mass than BMI. Pediatric Obesity. View on PMC
Further Reading
- Fitness Trumps Weight: New Research Shows VO2 Max Testing More Vital Than Ever — KORR Medical Technologies
- How to Track Fitness Progress Without a Scale — Nielsen Fitness
- 5 Ways to Track Fitness Progress Without a Traditional Scale — Experience Life
Image Credits
- Cover: Person wearing a black smart watch — Pexels
- Person measuring waist with a tape measure — Pexels
- Modern wearable technology with smart devices — Pexels
All images free to use under the Pexels License.